


Codata Factsheet | Boulogne-Billancourt (city centre)
Each month, Codata selects a city centre that has been recently studied by our team of data-collectors in order to share the latest trends observed on site.
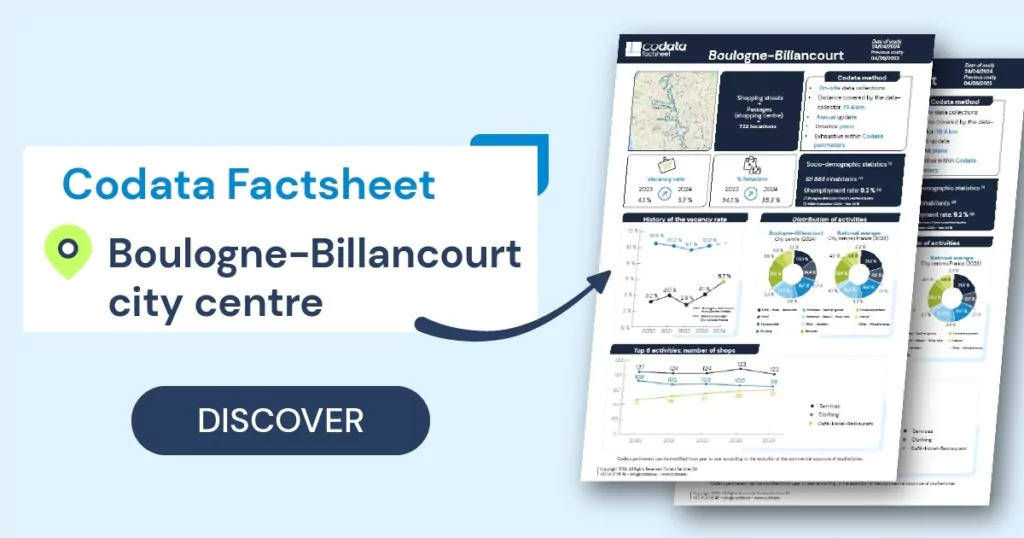
Last April, our team of data-collectors conducted the annual census of the city centre of Boulogne-Billancourt. The cluster encompasses two commercial sites totalling 722 locations, of which 606 are occupied by shops.
Commercial sites in the Boulogne-Billancourt cluster:
- Shopping streets
- Passages (shopping centre)
Commercial vacancy rate has increased: the proportion of empty retail locations went from 4.1% to 5.7% from 2023 to 2024.
In terms of activities distribution, the three most-represented activity in the city centre remain the same as last year.
The activity “Services” still ranks first in this top 3 with an occupancy rate of 20.1% (i.e. 122 locations occupied).
Second place goes to the “Clothing” activity with a 16.2% occupation rate (i.e. 98 shops). Finally, the activity “Café-Hotel-Restaurant” closes the ranking with a 15.0% occupation rate (i.e. 91 shops).
Unlike last year, when it decreased by 1.2 points, the proportion of retailers is increasing: 54.1% in 2023 compared with 55.3% in 2024.
For further details, please consult the Codata Factsheet.
For further information, please contact our team